New Oil Production Forecast – Awash in Oil
Over the last few months it was obvious that my Oil Production forecast was starting to drift away from actual United States oil production. Time for a deep dive into the data and update of the assumptions in the model. This article will describe what has changed in the relevant oil plays, and to write about what the implications are for the oil market.
Old Forecast
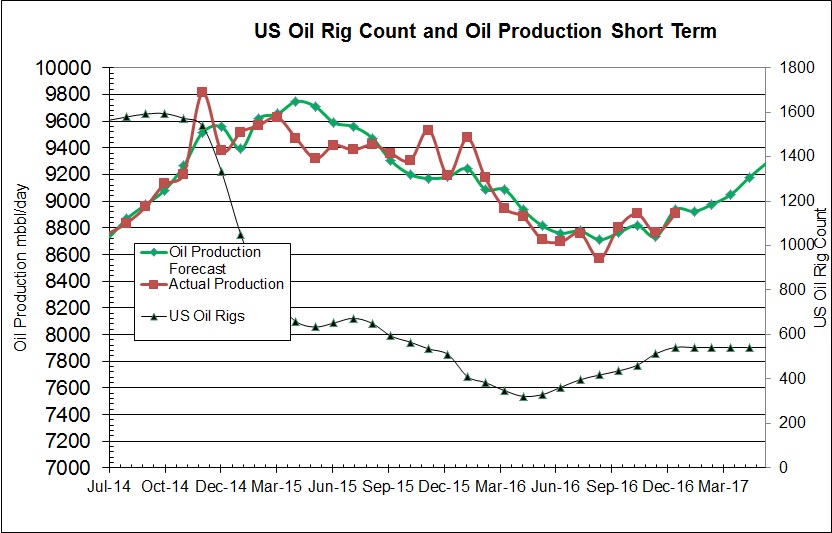
First let’s have a quick look at last months forecast and see where the problem exists.
As you can see, starting about on September 2016 the forecast indicated declining production, while actual oil production start to climb with the rising oil rig count.
EIA Rig Productivity Forecast
Each month the United States Energy Information Administration publishes a report on rig productivity called(not surprisingly) Drilling Productivity Report. This report has lots of great data on various oil and natural gas shale basins and the wells that are drilled into them. We could go on for many paragraphs about this report, but let’s just focus on some key information that I use to help generate the oil production forecast published on this website.
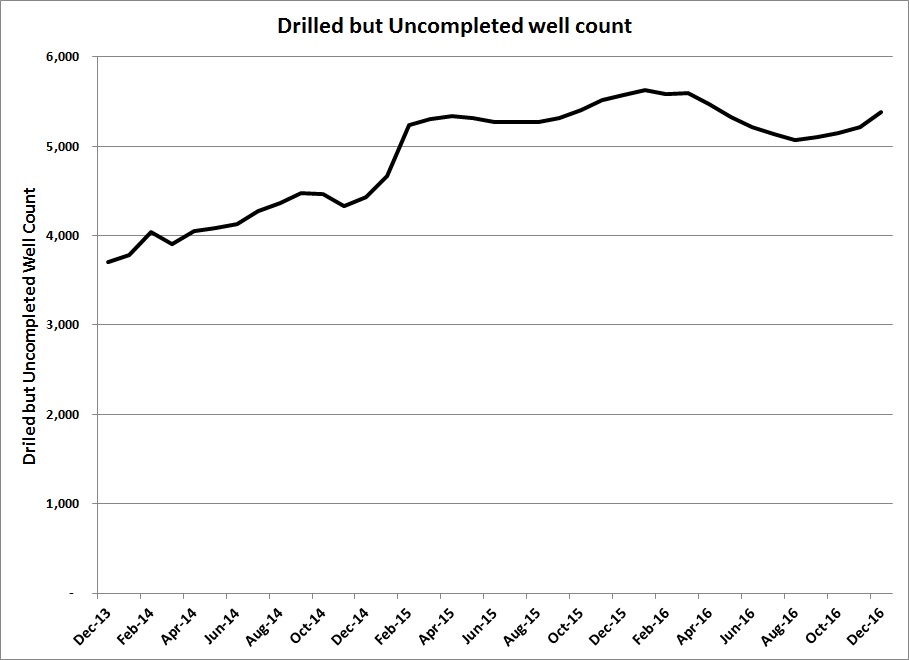
First is the Drilled Uncompleted well count, which are the number of wells that have been drilled but are waiting to be hydraulically fracced and put on production. In a factory this would be called work in progress.
As you can see the DUC well count has been steadily climbing since 2013 due to two reasons. The first reason is the use of pad drilling where one rig will drill 4 to 8 wells from a single surface location. While the rig is working on the 2nd, 3rd, etc.. well the wells can’t be completed and put on production, hence a larger number of wells waiting as industry moves toward the more efficient pad drilling. The second reason is the number of wells that have been drilled to hold leases and prevent their mineral lands from expiring and being leased to a competitor in the region. While the oil or natural gas may not be needed immediately due to the downturn in prices, oil companies will drill to hold the land for the future given the large resources in place on these lands.
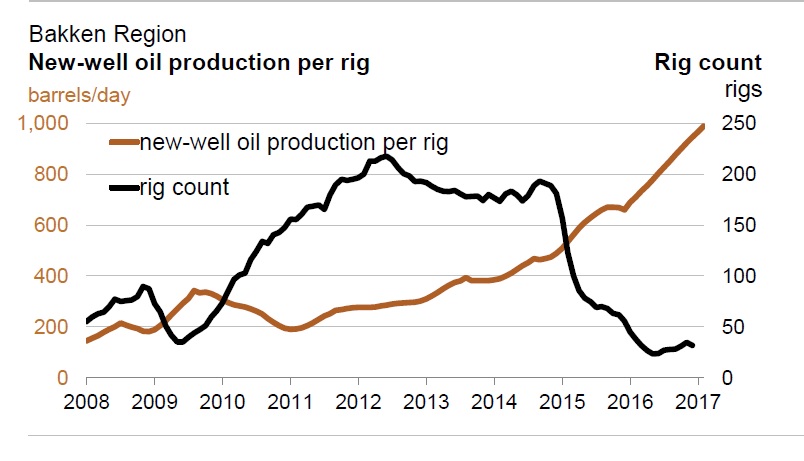
The second item that has implications on the production forecast is the new well oil production per rig. To illustrate this I extracted this chart from the report to show how rig productivity has climbed in the Bakken oil play.
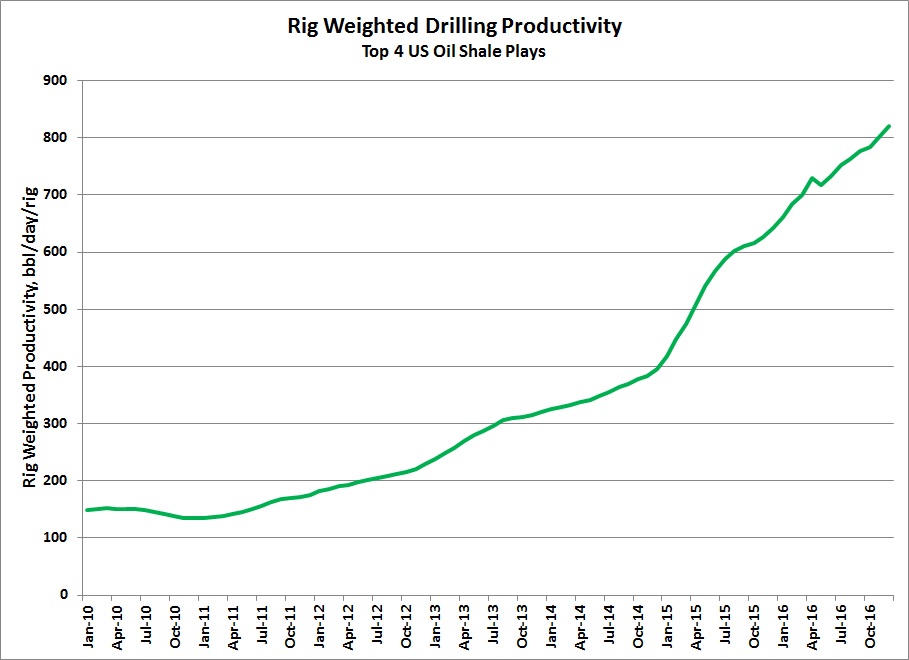
As is shown in the graph, from 300 bbl/day per rig in 2012, drillers now can add up to 1000 bbls/day per rig for the wells that they drill. This 3 fold productivity increase is what is driving the increase in oil production, even though the rig count is much lower than it was in the past when oil production started to rise. What complicates the analysis is that each play has its own productivity and own rig count so I derived a rig weighted productivity for the 4 main Oil Plays and generated this graph.
From 2012 to the end of this year, the amount of daily oil production from each rig went from 200 bbl/day to over 800 bbl/day when you average the 4 major oil plays in the US(Eagleford, Permian, Bakken and Niobara). The implications of this are quite large as the rig count climbs with the recent bump in oil prices. Rig count is driven by the rate of return that industry can achieve given a forecasted and actual oil price. That price looks like $50.00/bbl for the best plays. If the price rises further then the rig count could jump significantly and a wall of oil will follow. If the oil price and rig count climb too high then some more marginal parts of these basins will start to be drilled, pulling down the rig productivity, but not back to 2012.
Implications
Rigs are more productive, that is obvious but what does this mean for the future? The obvious one is that more oil will be produced for each rig. The result is a new forecast which shows oil production climbing for the rest of the year for the United States.
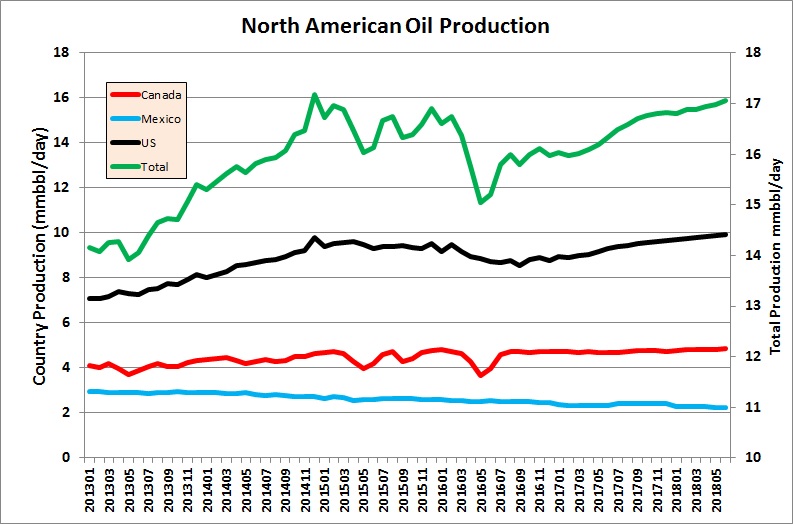
This also follows for the North American forecast that is on the Oil Production Forecast page.
Whereas in the past the forecast indicated that oil production in North America, including Canada and Mexico would drop with the existing rig count, it now climbs such that by mid 2018 we should see production equal the peak in late 2014. This assumes that the rig count stays flat and the rig productivity doesn’t plummet. A flat rig count is a big question since the rigs drilling for oil climbs every week as production companies feel more comfortable with the recent OPEC cuts and the firming oil price. What might happen if the price of oil rises to $60 or $70/bbl. Remember with this new rig productivity a rig today is at least 3 times better at increasing oil production than one from 2012. If the rig count climbs to 700 this would be equivalent to a rig count of 2100 in the past. In 2014 US oil production was climbing by 1 million bbl/day each year when the oil focused rig count was at 1600 rigs!
Where I am going with this is that for the time being the oil market may behave like the natural gas market where the price spikes are followed by a quick market response of more oil. This quick supply response should either moderate the price rise, or cause another price plunge that the natural gas market has just recently recovered from. Another implication is like natural gas rigs, the oil rig numbers should stay muted and capped.
This will have implications for the heavily debt levered producers(bad), high cost oil sands producers(bad) and drilling rig service companies with too much debt(bad). Be careful with your stock picks since this may continue for a while. As producers and service companies release their year-end reserves over the next month and half, I will update the data table with the numbers. Look for companies that show upside to their reserves value or discounted cash flow value, that have reasonable debt/cash flow numbers. Recent preliminary releases that I have glanced at, show good results for Athabasca Oil and Yangarra, both stocks that rank highly in value and reasonable debt loads. As always consult a qualified financial adviser before buying or selling any security.



Oh oh more pain to come from what you say here, I am also and bearish on oil and natural gas stocks. Glad you changed your mind, I was going to post a long comment about your oil forecast