PennWest – Significant Asset Sale
PennWest Petroleum recently announced a significant asset sale that realized $975 million by selling their Saskatchewan Dodsland Viking assets. This has transformed the company and likely enabled it’s survival(unless it is taken over). It is time to look at the announcement, what it means and see how this has changed the Net Asset Value of the company. Before this sale I would have predicted an event that would mean an end of the company(creditors calling loans), but always the NAV based on the reserve reports indicated the value of the company was higher than it’s net debt. In summary
- The announced metrics of the sale $18.40/boe 2P reserves and $71,400/BOE/day is much higher than the metrics that PennWest trades at on the stock market. As of the price before the asset sale of approximately $0.90/share the stock market was valuing the company at $27,700/BOE/day of production and $7.90/BOE 2P reserves.
- At this point in time it is unknown whether the good sale metrics mean that they sold their “good” assets and what is left does not have any drilling upside. To understand this we would have to wait until the end of the year and look for the Proved Undeveloped value that the yearend reserve reports indicate. Press release details by the company would indicate that there still is upside left in their core properties.
- The stock price is now significantly below their projected Net Asset Value
All this considered, lets analyze the announced sale metrics and drop in production and see what conceptually the company would have looked like at the end of Q1 if the sale had taken place then. We can use this to anticipate the future prospects for this company.
Production per Share
First lets reduce the production by the 13,650 boe/day and see what the production per share looks like if this happened in Q1 2016. We will assume that this is 90% oil since the properties sold were “oily”.

PennWest Production per Share
As you can see the production drop does show up on the graph, but they did not sell off the entire company. In fact according to their press release they still have significant upside left in their Cardium and Alberta Viking holdings.
Our redefined Cardium area will be focused on our unsurpassed land position encompassing 700 net sections and 1,500 drilling locations, or over 20 years of drilling activity. Our first quarter production in the Cardium area was approximately 19,500 boe/d with operating costs of $10/boe and netbacks of $17/boe. We expect the Cardium to continue driving profitable liquids growth through a combination of waterflood programs, infill drilling and new development for the foreseeable future. Recent production results from Cardium wells in both the Pembina and Willesden Green areas over the last two quarters continue to exceed expectations with production volumes meaningfully above historical type curves. Additionally, this transaction gives Penn West the financial flexibility to begin exploiting the multi horizon potential in our Cardium area. We hold approximately 500 net sections in the Belly River and Mannville formations that we believe are highly prospective. These plays will form part of our development strategy that we will be executing over the next several years.
In recent years our technical understanding of the Viking play has extended into Alberta through an active farm-out program as well as the exploratory findings and strong production results from offsetting peers. In the Alberta Viking we see the opportunity to replicate our Dodsland experience, with similar strong economics, but with much higher growth potential given the early stage life cycle of the play. While our Alberta Viking first quarter production was only approximately 1,000 boe/d, we expect this area will be an important focus of our 2017 development program and a key growth area in the foreseeable future. Our Alberta Viking position encompasses approximately 174 net sections and has over 500 potential drilling locations.
Sound very positive about the future. They will have to manage their assets better than in the past though. The production graph does show the steady erosion production per share over the last 3 years, and as you will see in the last graph, production correlates with reserve value.
Debt/share and Debt/cash flow
This graph shows the transformation in the Debt of the company with this transaction.

Debt per Share
As you can see here the debt per share will drop to below $1.50/share and the debt/trailing 4Q cash flow to below 4x, definitely transformative. If commodity prices remain strong as they are today, it is possible that the company will have dropped it’s debt/cash flow to below 2x, but this remains to be seen as the future quarters of production and price roll out over the next 6-12 months. They have announced that further assets sales will happen this year so we have to wait and see how much production will fall and where cash flow per share will stabilize.
Reserve value per share
As you may know if you have been following this blog, the NAV of the company is the reserve value less net debt. If you do the calculation with the sale proceeds as announced, then the NAV of the company jumps sharply and now the company is trading significantly below the PDP value as you can see in the following chart.

PennWest Net Asset Value
Selling off an asset at value metrics($/boe of reserves and $/boe of production) that is much greater than what the stock is trading at, definitely improves the value of the stock, even as it reduces the size of the company and the amount of the net debt.
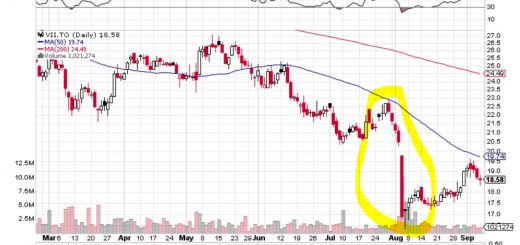
As you can see in the chart the value of the company has been steadily eroding over the last 3 years, and the trend started before the recent drop in oil and gas prices. Significantly though now, even with the recent jump in the trading price to $1.60/share, the shares are significantly undervalued and could be considered good value. Of course please consult an qualified financial advisor before selling or buying any security.
Recently other company deals have come to the market and I will blog about those in the next few days. Investment bankers have been busy shuffling the cards around and we will see how this changes the value that shows up in the NAV of the companies as time goes on.