Are We There Yet?
Watching the oil market bounce around and reading market commentaries on the internet,it is hard not to ask are we there yet. Is the oil price bottom in, and is the next leg up, where we only have blue skies and upward moving charts to look forward to? When asking this question it is best to look at the fundamental charts and see what they have to say. These charts also sit in the Oil Production Forecast part of the website.
To summarize what we are going to step through
- The actual oil production in the United States is consistently outperforming the forecast
- Combined US, Canada and Mexico production is flat to slightly down
- Oil and Products(gasoline, diesel, distillates) inventories are high and climbing which usually does not happen this time of the year(usually flat to slightly upward trending)
Oil Production Forecast
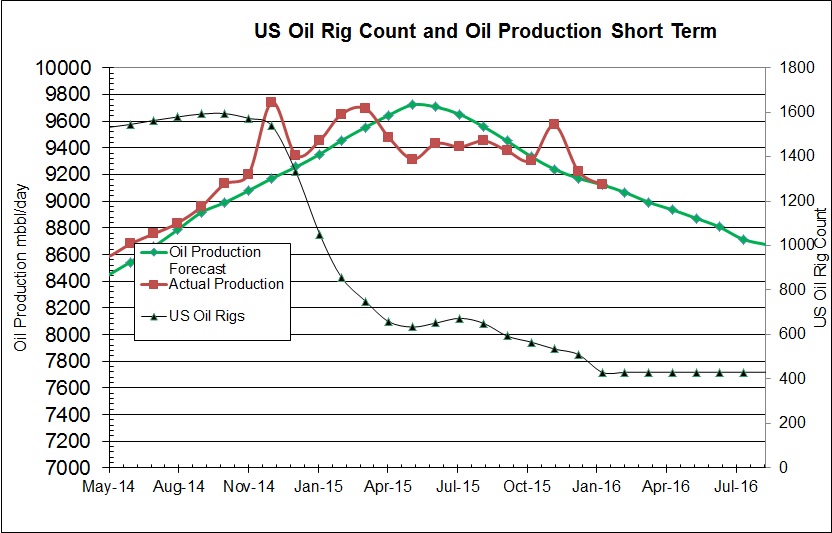
First lets look at the oil production forecast generated by NAV Information
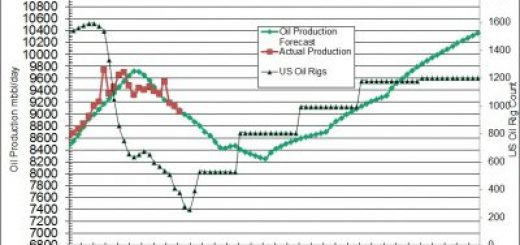
As could be expected the forecast shows that US oil production should fall to 8.7 million barrels per day by August helping solve the surplus amount of oil on the markets. If you can remember the forecast posted at the end of last year on NAVInformation.com, you will remember that the forecast indicated oil production would be below 9 million bbl/day today, and it is not. Production is consistently outperforming forecasts and I would expect this to continue. If you remember the blog post Look to the past to Predict the Future in the past when the price and rig count collapsed, oil production dropped a bit then went more or less flat. Now let’s look at the North American Supply picture.
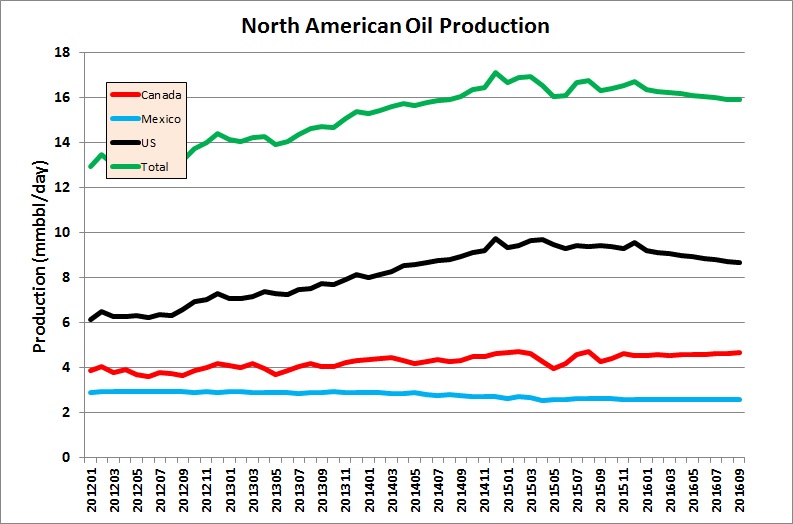
North American Oil Production and Forecast, Source Energy Information Association, NAVInformation.com
This is a plot of data extracted from the Energy Information Association website splicing on this website’s oil production forecast for the US. As you can see the forecast is much more muted for the downward trend of oil production such that the drop in US production is compensated somewhat by the increase in oil sands production in Canada.
Seasonal Days of Supply
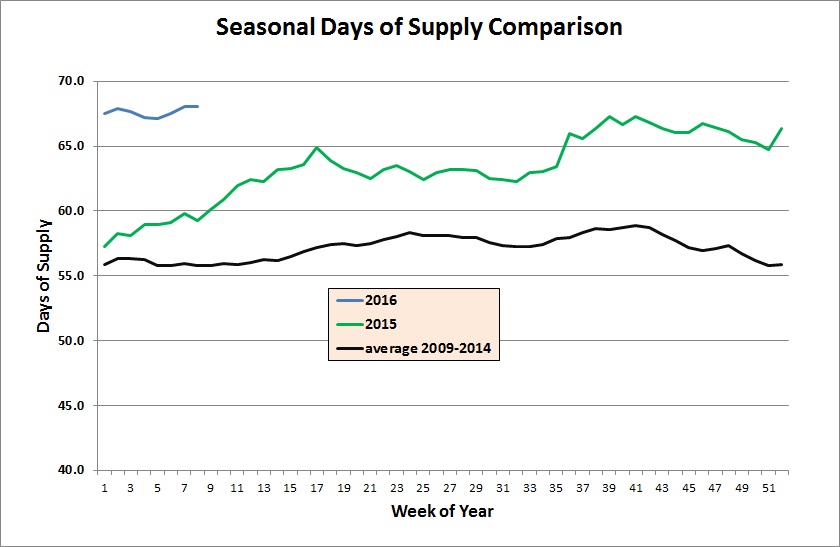
Now lets look at Season Days of Supply for what it indicates.
This time of the year usually the days of supply are flat, but now they are growing. Gasoline demand is up but distillate(heating oil) demand is down due to the warm winter.(El Nino)
Crude and Products Inventories
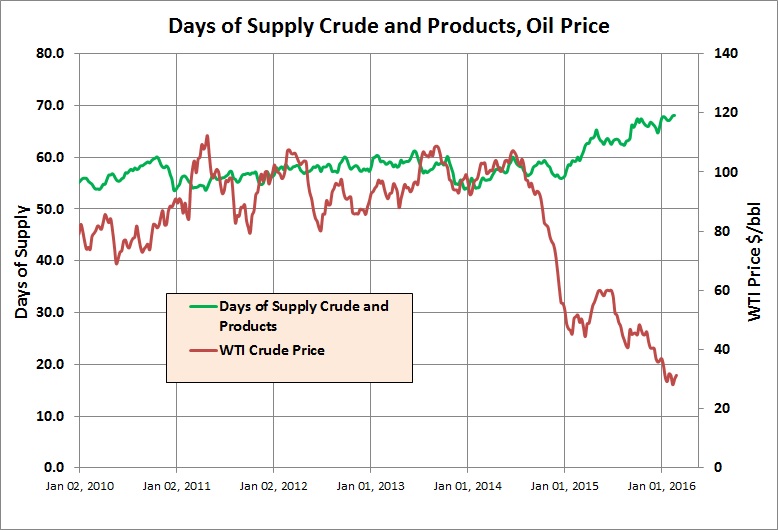
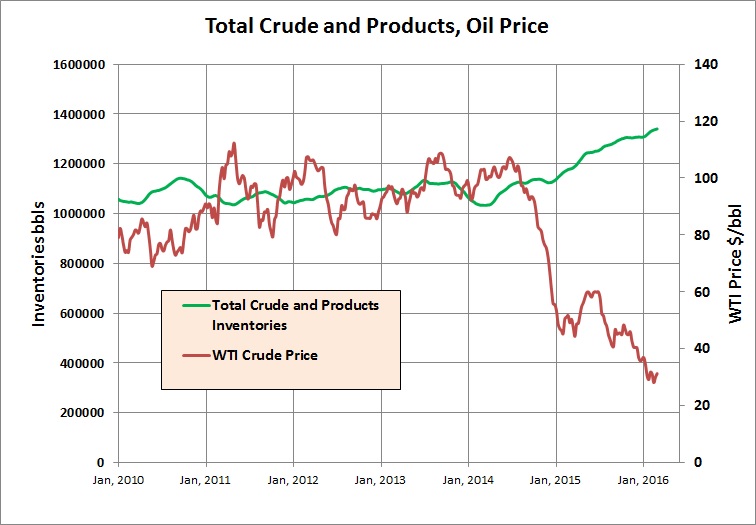
Now for some straight up plots to round out the discussion.
These last three plots all show an upward moving trend with no indications that the problem is solved. In fact they all look like the problem of too much crude and products on the market is getting worse. Be careful with the interpretation of recent movements in the oil market that the end of the correction in the markets is at hand.
So as is shown by the previous slide show the fundamentals are poor and haven’t improved yet. It is possible that the bottom is in regarding the price of oil, but it would not surprise me to see another move downward in the coming months before the true bottom is set. It is likely that it will take until the end of the year for the fundamentals(storage and production) to truly indicate the bottom is in the oil markets so wait patiently and sell the stock rallies and buy the downward corrections until the middle of the year.

